Cryptocurrency Charts
Charts can help you clearly see the market trend.
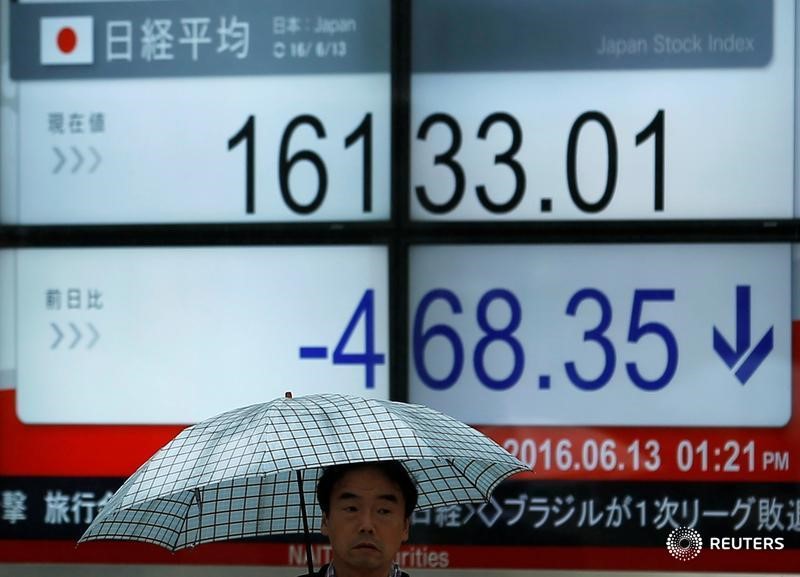
J225
Nikkei 225 Index Futures CFD
Past performance is not an indication of future results.
About
NI 225, the Tokyo Nikkei 225 Index, is the 225 stock price index of the Tokyo Stock Exchange launched by the Nikkei. Therefore, the index lasts for a long time and has good comparability. It has become the most commonly used and most reliable indicator to examine the long-term evolution and the latest changes in the Japanese stock market stock price.
Factors affecting NI 225
The Japanese yen exchange rate. Generally speaking, the yen rises with the stock market falling, while the yen falls with the stock market rising. BOJ monetary policies such as the interest rate and the inflation target Japanese government bond yield Wars, geopolitics, public health event, etc. Major political events will cause panic in the market, thereby putting pressure on the stock market.
Historical Market Review
NI 225 fell all the way from a high of 24,115 at the end of January 2020, and fell to 16,358 in mid-March, a drop of more than 7,757 pips. If one lot is traded at $100, the profit margin is as high as 5886%.
Economic data affecting NI 225 (by importance)
BOJ interest rate decision Japan trade balance Japan CPI Japan GDP